Power Solutions DFA Data
Fault study

Faulty assumptions

Textbooks say about 80% of faults are temporary. Breaker counts agree: 89% of breaker operations reclose and hold. But across 64,382 fault sequences on 676 US feeders, load was lost on 36% to 53% of reclose attempts.

89%of breaker operations reclose and hold
47%of reclose attempts end with nothing lost, or the load back within minutes
36%–53%of reclose attempts lose load
27%of fault sequences never see a reclose
History

Where "80% temporary" came from

It started as an assertion, not a count. These quotations trace the figure from breaker openings to faults.

  1. 1916 Ricketts (Baltimore)
    "More than 50 per cent of the short circuits on these feeders are of a temporary nature, and therefore clear themselves as soon as the feeder trips out" (p. 645)1

    The earliest share of temporary faults located, from operating experience; no count given.

  2. 1927 Anderson (General Electric)
    "from 75 to 90 per cent of the breaker openings are caused by temporary faults which disappear after the first, second or third reclosure" (p. 737)234

    No data; repeated in 1934. Earliest share of breaker operations located: Blake (GE), 1925, 58% held on the first reclose.

  3. Oct. 1934 GE, announcing the FP-19
    "experience shows that from 75 to 90 per cent of the faults are momentary and self-clearing, but will blow a fuse" (p. 25)56

    The same numbers, now said of faults, including faults beyond fuses that no breaker counted. Pacific Electric repeats the sentence in 1937.

  4. 1941 Logan & Miles (Georgia Power)
    "According to reliable statistics, approximately 85 per cent of automatic interruptions ... result from transient disturbances" (p. 1012)7

    Its own table counts breaker trips: 83% held on the first reclose. The T&D Reference Book later reprints it.

  5. 1945 - 47 Kyle; REA; Westinghouse
    "approximately 85 per cent" (Kyle, 1945, p. 261); "about 95%" (REA, 1945, p. 26); "about 80 per cent" (Westinghouse, 1947, p. 256)8910

    Two recloser makers and the REA's sectionalizing guide. None of the three gives data.

Initially, 75 - 90% was asserted of breaker openings; by 1934 it was said of faults, fuses included.

Sources · The full reference library

A thought experiment

Temporary and permanent: beyond the breaker

Round, made-up numbers on a simple feeder: enough to show what a breaker count measures, and what it misses.

Step oneThe feeder

Substation breaker Mainline lateral fuse lateral fault mainline fault
Fuse savingOne fast trip, then one slow. It always works.
80% on lateralsThe other 20% are on the mainline.
50% temporaryThe other 50% are permanent.

Step two100 faults, four outcomes

100faults
Temporary50 faults
1

On a lateral: 40 faults

Fast trip, reclose: the fault is gone and the fuse is saved.

Breaker: success Out: nobody
2

On the mainline: 10 faults

Fast trip, reclose: the fault is gone.

Breaker: success Out: nobody
Permanent50 faults
3

On a lateral: 40 faults

Fast trip, reclose; the fault returns and the fuse blows. The breaker holds.

Breaker: success Out: the lateral
4

On the mainline: 10 faults

Fast trip, reclose; the fault returns. Slow trip: lockout.

Breaker: lockout Out: the whole feeder

Outcome 3 is the gap. To a breaker count it looks exactly like outcome 1: one fast trip, one reclose that held. But the fault was still there, the fuse blew, and the lateral is out.

Step threeTwo ways to count

Count only the breaker

90% 10%
success: reclosed and heldlockout

Customers without power

50% 40% 10%
nobodya lateralthe feeder

Looking only at the substation breaker gives a 90% success rate.

But 40 of its 90 "successes" (44%) left a lateral without power, because the fault was permanent.

A breaker that held 90% of the time does not mean 90% of faults are temporary.

The headline

Follow the load, not the breaker

A breaker that recloses and holds says nothing about the fuse that blew behind it. So we followed the load. Of 46,726 reclose attempts, 47% were likely successes: nothing lost, or the lost load back within minutes.

Count only the breaker, and 9 in 10 faults look temporary.

As a breaker count sees it · 8,619 breaker operations

89% 11%
  • 7,666reclosed and held
  • 953locked out

What happened to the load · 46,726 reclose attempts

47% 36% 17%
  • 21,862Likely reclose success: nothing lost, or the lost load back within minutes
  • 16,839Reclose failure, high confidence: confirmed load loss after fault
  • 8,025Uncertain: unconfirmed load loss or no resolvable outcome
The range

Load lost on 36% to 53% of reclose attempts

We report a range because the substation sees all the current on a feeder, not every device on it. The low end counts only losses the recording shows. The high end adds load that went missing but that the interval data cannot confirm stayed off.

46,726 reclose attempts, by how much of the loss is confirmed

36% high confidence 53% upper bound

High confidence 36% · upper bound 53%

  • 16,839Load lost, shown in the recording
  • 7,818Load missing, loss not confirmed
  • 2,746Load back within minutes
  • 19,116Reclosed and held, nothing lost
  • 207No resolvable outcome
Reclosing shots

The first reclose does the work

Of the reclose attempts that ended with nothing lost, 86% held on the first reclose. The second added 9%; the third, 3%.

Only 14% of successes needed more than one reclose.

19,116 reclose successes with nothing lost, by the reclose that held

86%
9%
3%
2%
First reclose
16,401
Second
1,755
Third
618
Fourth or later
342
Real faults

Real faults break the textbook

Faults restrike, grow and hand off between devices. 9% of fault sequences change configuration mid-fault. When a single-phase-to-ground fault changes, it picks up a second phase 78% of the time.

Three recordings from the fleet:

Edge case: a fault that keeps growing

1 recording · 5 faults · September 2026

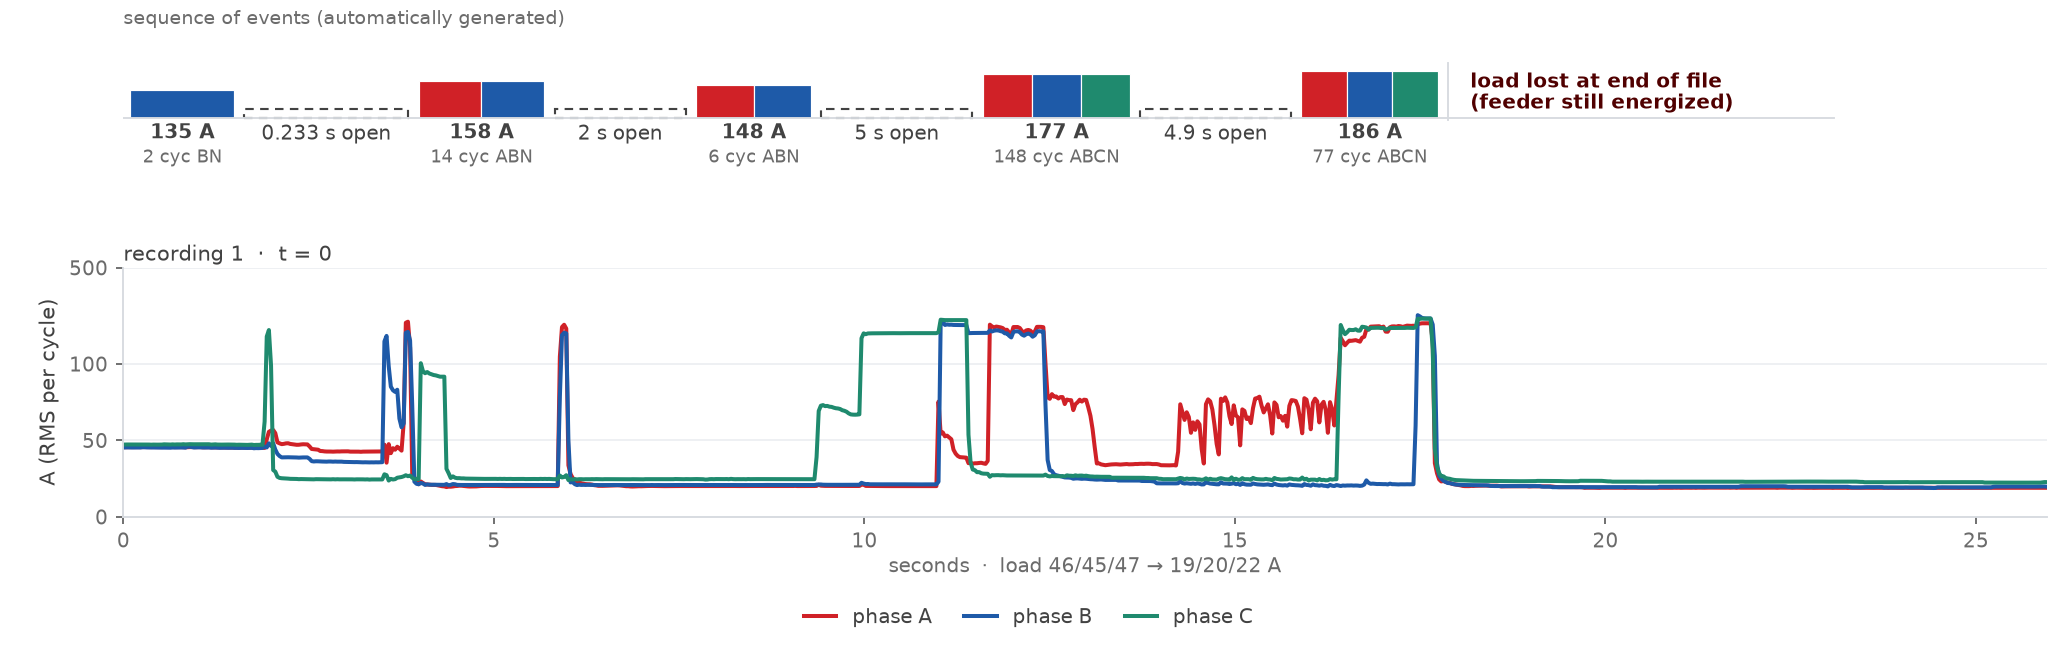
Reclose failed, downstream recloser locked out, load still off past five minutes Edge case: a fault that keeps growing: current per phase over the sequence

Tap the chart to enlarge it.

It starts on one phase, spreads to two, then to all three. A downstream recloser keeps closing back in, then locks out, and the load behind it stays off. What would you call it?

The breaker opens after a fuse (fuse-saving failure)

1 recording · 1 fault · October 2022

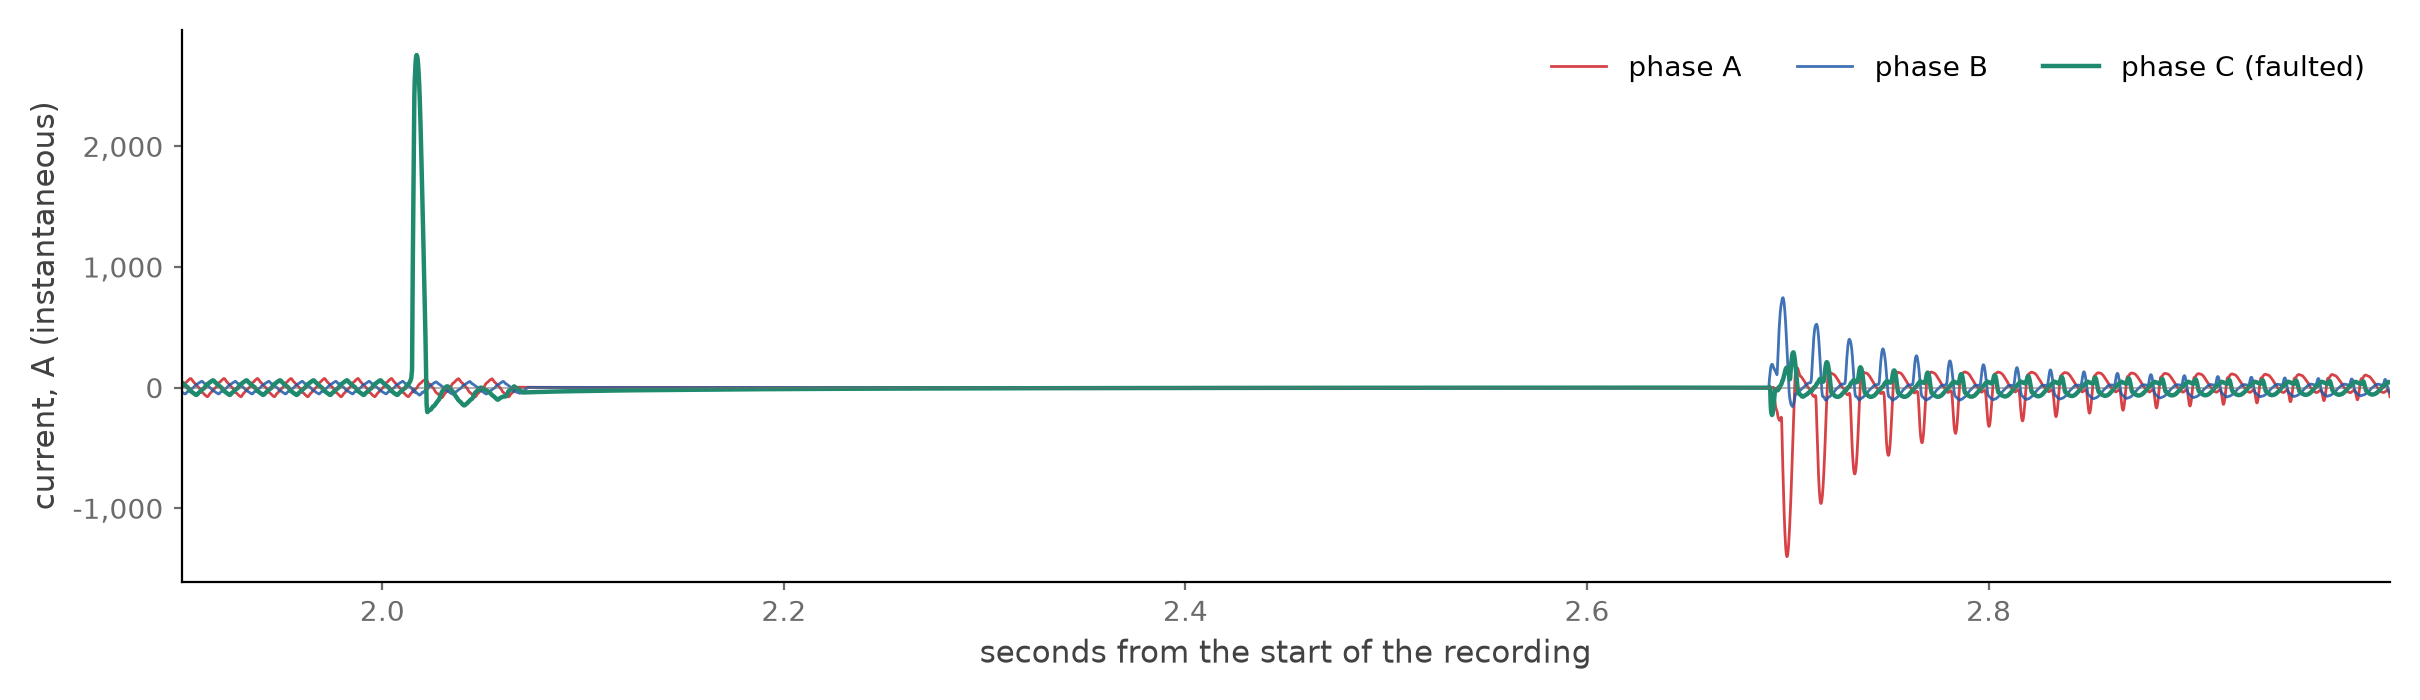
Reclose success, load lost, likely sustained interruption, fuse blow The breaker opens after a fuse (fuse-saving failure): current per phase over the sequence

Tap the chart to enlarge it.

A fuse clears the fault in half a cycle. The breaker trips anyway, recloses and holds. A breaker count logs a success; the customers behind the fuse lost power.

The full reading

A fault with a half-cycle peak of 2,717 amps (1,921 A rms, the figure in the table) cleared in half a cycle - faster than any recloser can open. Load current continued on the feeder for an additional 2.5 cycles before the substation breaker operated: the breaker saw the fault current, initiated its tripping sequence, and successfully reclosed for a fault which had already been cleared by a fuse. This is not a temporary fault: the reclose held because the fuse had already removed it, and the load behind the fuse was lost.

Jacob's ladders - faults that continue to restrike

1 recording · 3 faults · January 2026

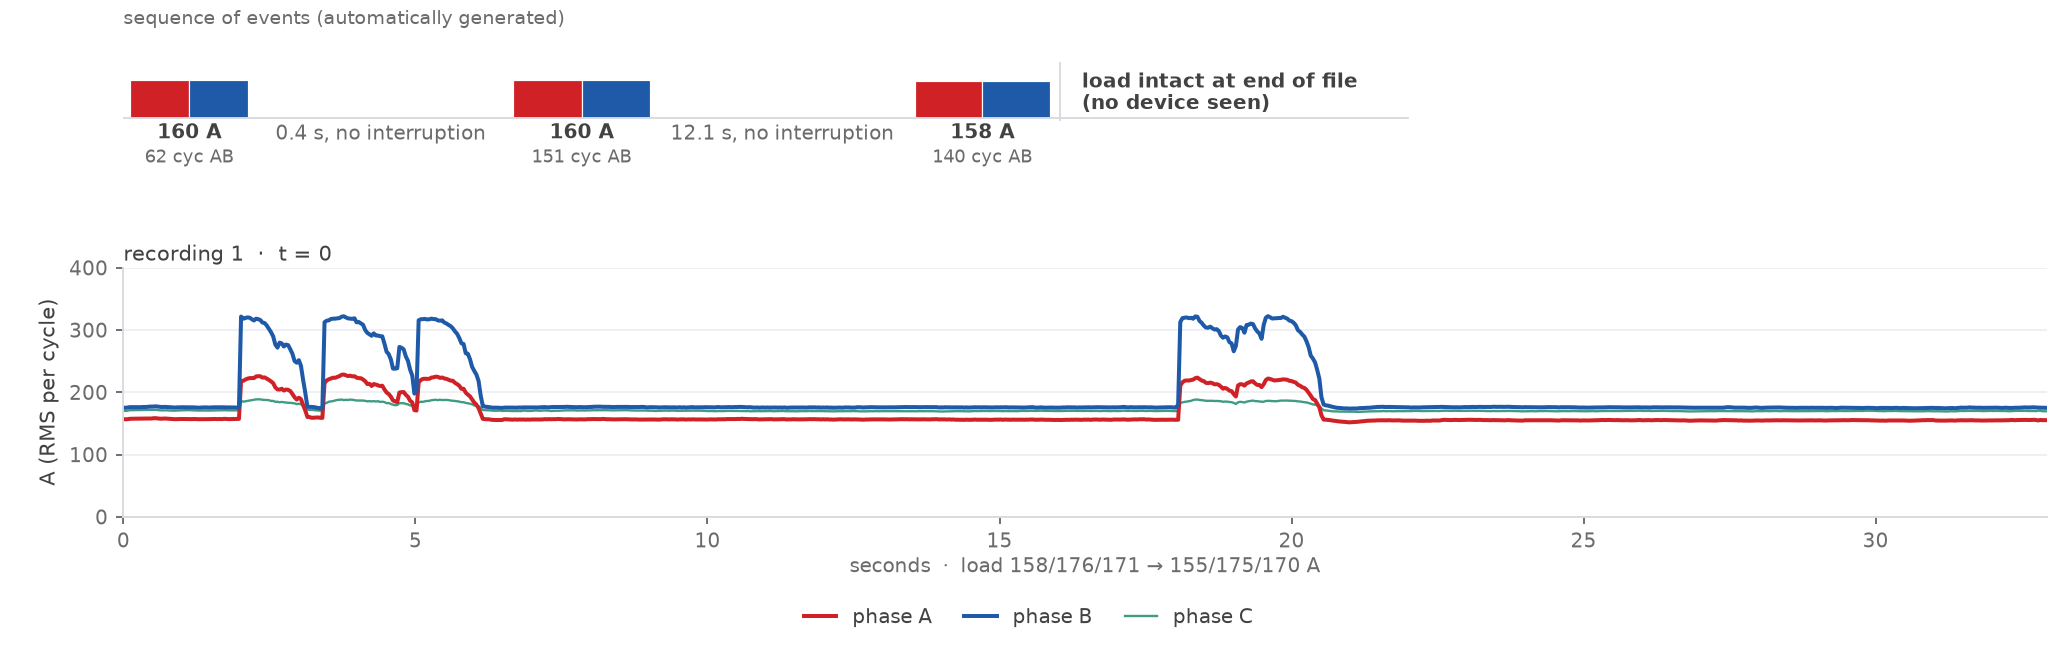
Likely self-cleared (no device seen) Jacob's ladders - faults that continue to restrike: current per phase over the sequence

Tap the chart to enlarge it.

An arc between two phases climbs, stretches and restrikes. No protective device operates. One label cannot describe it.

The full reading

An A-B fault initiates through an arc in air. As the arc rises due to heat, it lengthens, increasing its resistance (and decreasing the current). This creates a race condition between overcurrent protection and the ability of the arc to sustain itself in air. If the voltage is unable to sustain the arc, it self-extinguishes, and may (or may not) restrike depending on whether the fault condition is still present.

Weather

Storms multiply the fault rate

In storm conditions, faults arrive at 22 times the fair-weather rate. But fair weather fills 81% of the hours, so it still produces 52% of all fault sequences.

Plan for storms. Expect faults every day.

Fault sequences per 1,000 feeder-hours in each kind of weather

Fairgust <13 m/s (<30 mph), dry 2.5
Raingust <13 m/s, precipitation in the hour 9.8
Windygust 13–18 m/s (30–40 mph), dry 4.4
Windy + raingust 13–18 m/s with precipitation 15.5
Stormgust ≥18 m/s (>40 mph), wet or dry 53.7

Share of hours and of faults: Fair 81.5% / 51.9%; Rain 13.6% / 34.5%; Windy 3.3% / 3.7%; Windy + rain 1.3% / 5.0%; Storm 0.3% / 4.8%. Weather is the hourly reanalysis at the substation, not at the fault.

Then and now

EPRI EL-3085 (1983) beside today11

EPRI's EL-3085 study is still the reference most protection engineers know. Here is what it measured, beside what DFA measures today.

MeasureEL-3085, 1983DFA today
Sampleabout 120 recorded fault events; 50 feeders, 13 utilities, about 18 months64,382 fault sequences; 676 feeders, 22 utilities, 2,244 monitor-years
Smallest faults seenvery few records below 800 A (trigger levels set high to avoid load)50% of sequences peak below 800 A
Fault currentline-to-ground average 2,095 A; largest 6,100 Aaverage 1,080 A, median 800 A (the largest in each sequence); 1,720 A average above 800 A
Fault current durationline-to-ground average 8.35 cycles per event, every opening counted; longest event 73 cyclesmedian 3.5 cycles (every shot in a sequence); average 19.7, pulled up by a long tail: 10% of sequences run past 49 cycles, 6% past 73 (the 1983 study’s longest)
Single phase to ground79% of the faults utilities reported83% of sequences by the configuration held longest (as EL-3085 typed its events); 79% at the widest configuration each reached
One fault per eventabout 80% of recorded events (126)77% of sequences; 1.47 faults per sequence on average
One breaker opening was enoughabout 85% of events where the breaker operated (66)78% of 8,619 reclose attempts where the substation breaker opened
A fuse cleared the permanent fault88% of 237 faults utilities reported (they had estimated 59%)55% to 64% of sequences that ended with load lost (likely fuse blow; with "fuse unconfirmed")
Sources
  1. F. E. Ricketts, "The restoration of service after a necessary interruption," Trans. AIEE, vol. 35, pt. 1, pp. 635-654, 1916.
  2. A. E. Anderson, "Use of reclosing equipment on a. c. lines," Power Plant Engineering, vol. 31, no. 13, pp. 737-739, July 1, 1927.
  3. A. E. Anderson, "Automatic reclosing of oil circuit breakers," Electrical Engineering (Trans. AIEE), vol. 53, no. 1, pp. 48-53, Jan. 1934.
  4. D. K. Blake, "Opportunities and problems in the electric distribution system," Trans. AIEE, vol. 44, pp. 1072 ff., 1925 (Pacific Coast Convention, Seattle, Sept. 1925).
  5. R. M. Spurck and D. K. Blake, "Oil recloser for distribution," Electrical World, vol. 104, no. 13, pp. 24-25, 80, Oct. 27, 1934.
  6. E. F. Sixtus and W. R. Nodder, "A new service restorer," Electrical Engineering (Trans. AIEE), vol. 56, pp. 180-182, 152, Jan. 1937.
  7. J. T. Logan and J. H. Miles, "Factors contributing to improving electric service by means of high-speed switching and utilization of stored energy," Trans. AIEE, vol. 60, pp. 1012-1016, Dec. 1941.
  8. A. Van Ryan, "Improved fault protection for rural distribution systems," Trans. AIEE, vol. 64, no. 5, pp. 261-263, May 1945.
  9. U.S. Rural Electrification Administration, Procedure for Making a Sectionalizing Study, REA Technical Standards Bulletin 4A (revised), Dec. 3, 1945.
  10. J. M. Wallace, "An improved automatic circuit recloser," Trans. AIEE, vol. 66, pp. 255-263, 1947.
  11. J. J. Burke, D. A. Douglass, and D. J. Lawrence, "Distribution fault current analysis," EPRI EL-3085, Project RP1209-1, final report, May 1983.

Every reference in the deck, and the reclosing library

DFA

See what your feeders are doing

DFA connects to the CTs and PTs already in your substation and turns every fault into an answer: what happened, which device acted, and who lost power.